Data Visualization Developer CV Example
Slicing and dicing data, but your CV feels like it needs a graph? Dive into this Data Visualization Developer CV example, visualized with Wozber free CV builder. Witness how you can chart your coding prowess to align with job requirements, making your career path as impactful and engaging as your visualizations!
How to write a Data Visualization Developer CV?
Embarking on a journey as a Data Visualization Developer involves not only honing your technical chops but also presenting your prowess in a CV that resonates with hiring managers. With the unique blend of art, science, and impact that defines data visualization, your CV should echo this trio harmoniously. Wield the power of Wozber's free CV builder, designed to guide you towards an ATS-compliant CV that showcases your story through data.
Are you ready to plot your professional narrative in a way that catches every recruiter's eye? Let's transform that canvas of experience into a masterpiece!
Personal Details
The first brushstroke to your CV masterpiece addresses who you are with clarity and relevance. Here, every detail lays the foundation for your narrative, setting the stage for a deeper exploration of your professional journey. Let's refine this section into a refined self-portrait.
1. Brand Yourself
Your name isn't just a label; it's the title of your professional story. Ensure it beams with clarity and distinction atop your CV. A legible, slightly larger font can make your name memorable at first glance.
2. Job Title Alignment
Mirror the job title "Data Visualization Developer" just below your name. This alignment acts as an immediate cue to hiring managers, underlining your career focus and aspirations with precision.
3. Essential Contact Info
- Phone Number: List your most reliable contact number, double-checking for accuracy.
- Professional Email Address: A simple, professional format (firstname.lastname@email.com) maintains a polished image.
4. Geo-Targeting
"Must be located in San Francisco, California" - a clear prerequisite. By listing "San Francisco, California" as your base, you align seamlessly with the logistical requirements, reassuring recruiters of your availability.
5. Digital Footprint
Consider including your LinkedIn profile or a personal website relevant to your profession. Ensure its content complements your CV, offering a richer, more comprehensive view of your professional landscape.
Takeaway
Crafting an inviting yet professional introduction is akin to a firm, confident handshake - it sets the precedent. Pay attention to the fine details, ensuring each element is attuned to the Data Visualization Developer role you aspire to secure. Let your introduction be the doorway to your expertise and passion.


Experience
The experience section is where your career journey unfolds in vibrant, actionable detail. It's your professional gallery, showcasing the impact you've had through your roles. Let's sculpt this section to highlight your contributions and alignment with the Data Visualization Developer role.
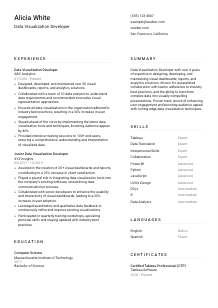
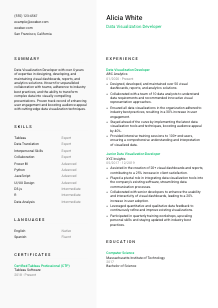
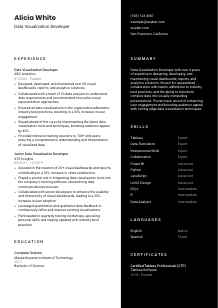
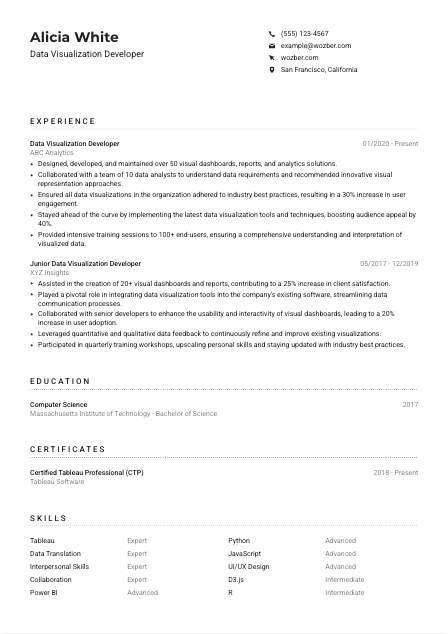
- Designed, developed, and maintained over 50 visual dashboards, reports, and analytics solutions.
- Collaborated with a team of 10 data analysts to understand data requirements and recommended innovative visual representation approaches.
- Ensured all data visualizations in the organisation adhered to industry best practices, resulting in a 30% increase in user engagement.
- Stayed ahead of the curve by implementing the latest data visualization tools and techniques, boosting audience appeal by 40%.
- Provided intensive training sessions to 100+ end‑users, ensuring a comprehensive understanding and interpretation of visualized data.
- Assisted in the creation of 20+ visual dashboards and reports, contributing to a 25% increase in client satisfaction.
- Played a pivotal role in integrating data visualization tools into the company's existing software, streamlining data communication processes.
- Collaborated with senior developers to enhance the usability and interactivity of visual dashboards, leading to a 20% increase in user adoption.
- Leveraged quantitative and qualitative data feedback to continuously refine and improve existing visualizations.
- Participated in quarterly training workshops, upscaling personal skills and staying updated with industry best practices.
1. Dissect the Role
Begin by deconstructing the job requirements, pinpointing specifics like "experience in data visualization tools such as Tableau, Power BI, or D3.js", and structuring your experience to reflect these requirements.
2. Chronological Artistry
Lay out your experience like a curated exhibition, starting with your most recent role. Emphasize companies worked for, job titles held, and the period of engagement, setting the stage for your achievements to shine.
3. Showcase Achievements
Transform each responsibility into a captivating story of success. Highlight your expertise in data visualization projects, mentioning specific tools and technologies you've excelled in, mirroring the job's requirements. Whenever feasible, quantify your achievements to give them weight.
4. Quantify Your Impact
Whenever possible, use numbers to convey the scale of your impact. For instance, "Enhanced user engagement by 30% by adhering to best practices in data visualization" speaks volumes.
5. Relevance is Key
Maintain a laser focus on relevancy, tying every achievement back to the job at hand. Extraneous information can distract from the narrative you're aiming to tell as a Data Visualization Developer.
Takeaway
Your experience section is a testament to your journey and the value you've brought to past projects and teams. Refined, well-quantified achievements that reflect the job requirements will catch a hiring manager's eye, painting you as the ideal candidate for the role. Use this section to compellingly argue your fit for the Data Visualization Developer position.
Education
Even though your skills and experience take the front seat in a Data Visualization Developer role, your educational background still plays a crucial part in your CV, providing a glimpse into your foundational knowledge. Let's optimise this section to resonate with your desired role.
1. Match the Requirement
Highlighting your "Bachelor's degree in Computer Science, Information Systems, or related field" aligns perfectly with the required educational background, establishing your candidacy's foundational strength.
2. Simplicity in Structure
Present this section with elegance and simplicity: List the degree, field of study, institution, and graduation date in a clear, concise manner, ensuring easy readability.
3. Relevant Degree Showcase
Directly referencing your degree, especially when it mirrors the job requirements, reinforces your suitability for the role. In this case, stating your Bachelor in Computer Science from a respected institution speaks directly to the job's core needs.
4. Additional Learning
If your journey includes relevant coursework, workshops, or projects that particularly align with the Data Visualization Developer role, briefly mention these to add depth to your educational backstory.
5. Honors and Extracurriculars
While primarily focusing on the degree, don't overlook honors or extracurricular activities that demonstrate a broader engagement with your field or community. These can subtly enhance your profile, especially for entry-level roles.
Takeaway
Your educational section is a cornerstone that supports the narrative of your professional capabilities as a Data Visualization Developer. Tailor this section to not only fulfill but enhance how your education aligns with the job requirements, painting a comprehensive portrait of your preparedness for the role.
Certificates
In the ever-evolving field of data visualization, certifications act as badges of dedication, learning, and expertise. Highlighting relevant certifications can considerably bolster your CV, signaling your commitment to continuous professional growth.
1. Sync with Job Needs
While the job description may not specify certifications, including relevant ones like "Certified Tableau Professional (CTP)" directly aligns with the required skills and sets you apart.
2. Quality Over Quantity
Focus on certifications that resonate most strongly with the Data Visualization Developer role. This ensures your CV remains concise and targeted, showcasing your most pertinent qualifications.
3. Date Specifics
Mentioning the acquisition dates of certifications, especially if they are recent, adds to your profile's currentness. It subtly communicates your up-to-date expertise in the field.
4. Continuous Learning
Data visualization is dynamic, and so should be your learning journey. Continuous updating of your certifications section signals an adaptive mentality, crucial for staying ahead in the field.
Takeaway
Your certifications are a tangible showcase of your continuous commitment to professional excellence. By selecting and presenting the ones most aligned with the Data Visualization Developer role, you underscore your readiness and provide a competitive edge. Always aim for certifications that add depth and relevance to your expertise.
Skills
In the data visualization realm, your skills are your tools. This section needs to be a well-curated display of technical proficiency combined with interpersonal finesse. Let's masterfully align your skills with what's sought for a Data Visualization Developer.
1. Extract and Match
Sift through the job description, extracting key skills such as proficiency in "Tableau, Python, and JavaScript specifically for data visualization purposes." Directly aligning these in your CV ensures you're speaking the same language as hiring managers.
2. Prioritize Relevance
While it might be tempting to list every skill under the sun, focus on what matters most. Prioritize skills that the job description emphasizes to keep your CV sharp and on target.
3. Organisation is Key
Organize your skills into categories, separating technical skills from soft skills like "strong interpersonal skills," for a clear, at-a-glance overview that hiring managers will appreciate.
Takeaway
Your skills section is a showcase of your professional toolbox. By carefully selecting and aligning your skills with the job requirements, you give hiring managers a clear picture of why you're the perfect fit for the Data Visualization Developer role. Remember, each skill you list is a brushstroke that contributes to the overall impression of your expertise.
Languages
In our interconnected world, your ability to communicate in multiple languages can be a significant asset, even in roles not directly related to language. For a Data Visualization Developer, fluency in English was specified, but let's explore how additional languages can augment your CV.
1. Align with Requirements
Firstly, ensure you clearly indicate your proficiency in English as "Native" or "Fluent," directly addressing the job's core language requirement.
2. Add Extra Languages
Beyond the essentials, listing additional languages, especially if they're relevant to the company's market or clients, showcases your versatility and global mindset.
3. Honesty in Proficiency
Be transparent about your level of fluency. Using terms like "Native," "Fluent," "Intermediate," and "Basic" provides a clear understanding of your linguistic capabilities.
4. Consider the Role's Scope
If the role involves interaction with international stakeholders or markets, your multilingual abilities can be particularly appealing, highlighting how you can bridge communication barriers.
5. Evolving Language Skills
A dedication to improving your language skills, just like technical skills, exemplifies a growth mindset, a valuable trait in any professional field.
Takeaway
Your linguistic abilities, while perhaps not the centerpiece of a Data Visualization Developer CV, add another layer of appeal to your profile. They're indicative of your ability to navigate diverse environments—a critical asset in today's globalized workplace. View each language as a unique tool in your kit, enhancing your professional narrative.
Summary
Your summary is the preface to your professional tale. It serves as an enticing overview, drawing hiring managers into your narrative. A compelling summary can be the difference between a glance and a deep dive. Let's craft yours with the Data Visualization Developer role in mind.
1. Grasp the Role's Essence
Understanding the core of the Data Visualization Developer role allows you to align your summary closely with what recruiters are seeking. Absorb the nuances of the job description to ensure alignment.
2. The Opening Line
Start with a vibrant introduction that encapsulates your professional identity and experience. For example, "Data Visualization Developer with over 4 years of expertise" immediately signals your relevance and experience.
3. Highlight Key Qualifications
Spell out your skills and accomplishments that align with the job's critical demands. Mention your proficiency in tools like Tableau and Power BI, as well as your success in translating complex data into compelling visual stories.
4. Craft Concisely
While it's tempting to include every detail of your career, a summary needs to be precisely that—a summary. Aim for a punchy, engaging teaser of your CV, prompting hiring managers to delve deeper.
Takeaway
Your summary is more than a mere overview; it's your banner, proudly flying with the essence of your professional identity. Tailored closely to the Data Visualization Developer position, it beckons hiring managers to explore further, setting you apart as the candidate they've been searching for.
Launching Your Data Visualization Developer Journey
Congratulations on structuring a CV that resonates with the essence of a Data Visualization Developer. With Wozber's free CV builder, your CV not only meets the industry standards but surpasses them with an ATS-compliant format and keyword optimisation. Remember, crafting your CV is a step towards narrating your professional story.
Let it be dynamic, engaging, and reflective of your dedication to the craft of data visualization. The canvas awaits, and it's time to paint your career in the most vivid hues!

- Bachelor's degree in Computer Science, Information Systems, or related field.
- Minimum of 3 years of experience in data visualization tools such as Tableau, Power BI, or D3.js.
- Proficient in programming languages such as Python, R, or JavaScript specifically for data visualization purposes.
- Ability to translate complex data into easily understandable visual presentations.
- Strong interpersonal skills and the ability to collaborate with cross-functional teams.
- Proficient English speaking and listening skills necessary.
- Must be located in San Francisco, California.
- Design, develop, and maintain visual dashboards, reports, and analytics solutions.
- Collaborate with data analysts and business stakeholders to understand data requirements and recommend visual representation approaches.
- Ensure data visualizations adhere to industry best practices and accessibility standards.
- Stay updated with the latest data visualization tools and techniques to continually enhance the visualization capabilities of the organization.
- Provide training and support to end-users to effectively understand and interpret visualized data.

