Use Wozber and land your dream job
Create Resume
No registration required
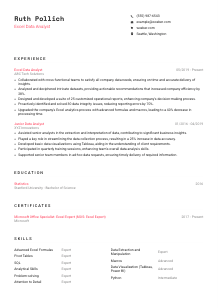
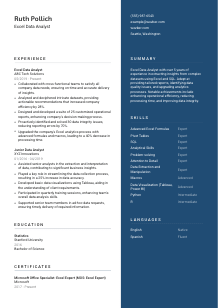
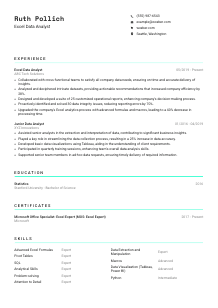
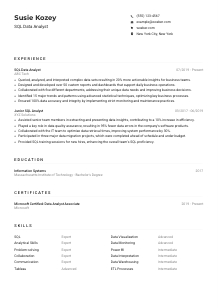
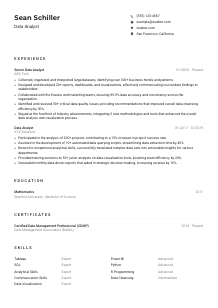
Cracking formulas, but puzzled by your resume layout? Check out this Excel Data Analyst resume example, created with Wozber free resume builder. It shows how to present your data-driven dexterity in a way that matches job prerequisites, plotting your career course without any missing values!

Excel Data Analyst work sits at the point where messy raw numbers need to become usable business decisions. Hiring teams look for people who can move comfortably from data extraction to pivot-table analysis, catch integrity issues before they hit a dashboard, and turn spreadsheet output into reporting that operations, finance, or leadership can actually use.
When that process is reflected clearly on the page, your resume is easier to rank in an ATS and easier to read as proof of day-to-day capability. Wozber's free resume builder helps you align your wording with the posting, keep an ATS-friendly resume format, and surface the Excel, SQL, reporting, and data-quality work that matters most for an Excel Data Analyst opening.
For an Excel Data Analyst, the contact section should communicate accuracy and availability right away. Small errors here can undercut the detail-oriented image you need for a role centered on clean data, reliable reporting, and precise analysis.
Use your full name in a clean, readable format that stands out more than the rest of the header. Keep it simple and professional. For analytical roles, polished presentation matters because it sets the tone for how carefully the rest of your resume is likely to be reviewed.
Place "Excel Data Analyst" directly beneath your name when that is the role you are targeting. This helps recruiters and ATS systems connect your resume to the opening immediately, especially when employers are sorting among adjacent profiles such as Data Analyst, Reporting Analyst, or Business Analyst.
List a reliable phone number and a professional email address, then check both twice. Analysts are trusted with accuracy, and even a typo in your email can create the wrong impression. A straightforward format such as firstname.lastname@email.com keeps the header consistent with the precision expected in reporting work.
If the posting specifies a location requirement, reflect it clearly in your header. In this example, Seattle, Washington is explicitly requested, so showing that location removes a practical question before it arises. If you are relocating, state that plainly rather than leaving the employer to guess.
Include LinkedIn or a portfolio link if it supports your candidacy with reporting samples, dashboard work, SQL projects, or data process improvements. For this profession, a link is most useful when it reinforces analytical work, not when it leads to a generic profile with little evidence of Excel or reporting experience.
Keep this section clean, complete, and aligned with the posting. It should tell the employer that you are reachable, professionally presented, and logistically ready for the role before they even reach your experience bullets.


This is the section hiring managers read to understand how you work with real datasets, business questions, and reporting cycles. For an Excel Data Analyst, they want to see more than tool names. They want proof that you improved reporting accuracy, sped up analysis, supported decision-making, or solved data quality problems in a measurable way.
Start by identifying the recurring work in the posting, then mirror that language where it matches your background. Here, the role centers on cross-functional collaboration, complex data analysis, custom reports and dashboards, and data integrity work. Those themes should shape which bullets you keep, cut, or rewrite.
List your most recent position first and make each entry easy to scan with company name, title, and dates. That structure helps a reviewer follow your progression from junior analytical support into more independent reporting, Excel automation, SQL querying, or stakeholder-facing analysis.
A generic line such as "created reports" says very little. A stronger bullet explains what you built, for whom, and what changed because of it. The sample resume does this well by tying customized operational reports to better decision-making and by linking complex data analysis to a 28% efficiency gain. That is the level of specificity you want.
Metrics belong naturally in data roles, so use them wherever they reflect scope or outcome. Good examples include number of reports built, reporting error reduction, processing time saved, accuracy gains, records handled, or frequency of dashboard delivery. The sample's 25 reports, 70% error reduction, and 40% faster processing give hiring teams a concrete sense of scale and impact.
Prioritize experience that supports Excel-heavy analytics work, SQL use, visualization exposure, and data problem-solving. Older or less relevant tasks can be shortened or removed. If a bullet does not help explain your reporting ability, analytical judgment, or contribution to business decisions, it is taking space from stronger material.
Your experience section should read like a track record of usable analysis. By the end of it, the employer should be able to picture you handling reporting requests, cleaning data issues, building Excel-based analysis, and delivering findings that hold up under scrutiny.
Education matters here because many Excel Data Analyst roles ask for a quantitative foundation. A degree in statistics, mathematics, economics, or a related field helps confirm that you can work comfortably with structured analysis, data interpretation, and business reporting logic.
If the posting asks for a bachelor's degree in a quantitative or related discipline, make sure that information is easy to find. In this example, a Bachelor of Science in Statistics aligns directly with the employer's stated requirement and strengthens the case early.
List your degree, school, field of study, and graduation year in a straightforward format. Recruiters usually scan this section quickly, so clarity matters more than embellishment. Make it easy to confirm that you meet the baseline academic requirement.
If your degree is closely tied to analytics, keep the field visible instead of shortening the entry too much. Statistics, mathematics, economics, information systems, and similar subjects all signal comfort with quantitative reasoning, which supports work in Excel modeling, SQL querying, and reporting analysis.
Most mid-career analysts do not need a course list. Include one only if it sharpens your match, especially if you are early in your career or shifting into analytics from another path. Classes in statistical analysis, database systems, business intelligence, or spreadsheet modeling can add useful context.
Honors, projects, research work, or student roles are worth mentioning when they show analytical thinking or practical data work. For example, a capstone involving dashboard design, forecasting, or SQL-based analysis can strengthen an early-career resume without crowding the section.
This section does not need much space, but it should clearly support your analytical credibility. When the degree aligns with the posting, it helps remove doubt about your foundation for data-heavy work.
Certifications are especially useful in Excel-centric analyst roles because they can validate technical depth beyond a degree title. They work best when they support the actual work of the job, such as advanced spreadsheet use, data management, reporting, or analytics tooling.
If the posting does not require certifications, use this section to strengthen relevant expertise rather than to fill space. Credentials such as Microsoft Office Specialist: Excel Expert or data management certifications are a strong fit for roles that rely on advanced formulas, macros, structured reporting, and data accuracy.
A short list of targeted certifications is more persuasive than a long list of loosely related courses. Pick the ones that support the role's daily work, whether that is Excel automation, database handling, business intelligence, or data governance.
Include issue dates and, when relevant, active or renewal status. Current credentials suggest that your tool knowledge is up to date, which matters in environments where reporting practices, Excel capabilities, and BI workflows continue to evolve.
Use future certifications strategically. If you already have strong Excel experience, the next useful additions might be in Power BI, Tableau, SQL, data visualization, or data quality management. That progression shows growth in the exact areas many analyst teams use every week.
A well-chosen certification section reinforces the technical side of your profile without repeating the rest of the resume. It should support the picture of someone who can handle advanced Excel work, reliable reporting, and disciplined data practices.
For an Excel Data Analyst, the skills section should reflect how the work actually gets done. That means balancing core spreadsheet capabilities with SQL, reporting logic, visualization tools, and the judgment needed to catch errors and interpret results.
Start with the language the employer already uses. In this case, advanced Excel formulas, pivot tables, macros, SQL, data visualization tools, analytical thinking, problem-solving, and attention to detail all belong near the top because they describe the day-to-day toolkit for the job.
Include both hard skills and the judgment-based abilities that support them. Excel, SQL, Tableau, and Power BI show tool fluency. Analytical skills, problem-solving, and attention to detail show that you can interpret outputs, catch anomalies, and make the data useful instead of simply moving it around.
Lead with the skills that are central to the role rather than every tool you have touched. For this opening, advanced Excel work and SQL deserve more prominence than secondary tools. The example resume handles this well by giving expert-level emphasis to formulas, pivot tables, SQL, and data extraction before listing Python or R as supporting skills.
A focused skills section should make it obvious that you can analyze data in Excel, pull and manipulate it with SQL, and support reporting with the accuracy the role demands. Keep the list relevant enough that every item strengthens your case.
Language ability matters in analytical roles when the work involves explaining findings, clarifying requests, and documenting reporting output for non-technical stakeholders. If the posting names a language requirement, treat it as a real qualification rather than a minor detail.
If English speaking and comprehension are required, list English prominently and label your proficiency accurately. This matters because Excel Data Analysts often gather requirements from multiple teams and present findings in written reports, dashboard notes, or meetings.
Other languages can strengthen your profile, especially in multinational organizations, customer-facing environments, or teams that work across regions. They are usually secondary for this role, but still useful when communication breadth supports collaboration.
Stick to recognizable labels such as Native, Fluent, Intermediate, or Basic. Hiring teams do not need inflated wording here. They need a realistic sense of whether you can communicate comfortably in meetings, documentation, and day-to-day business exchanges.
Do not overbuild this section unless language use is central to the role. For most Excel Data Analyst positions, English fluency is the key point, and any additional language is a helpful extra rather than a deciding factor.
Even in spreadsheet-heavy positions, analysts need to explain numbers clearly. This section should confirm that you can handle the communication demands that sit alongside the technical work.
The summary should quickly establish the kind of analyst you are, the tools you rely on most, and the results your work tends to produce. In this field, a vague opening wastes valuable space. Lead with analytical scope, Excel and SQL strength, and one or two outcomes that make a hiring manager want to read the experience section next.
Review the posting before you write a single line. If the role emphasizes Excel depth, SQL, dashboards, and data quality, your summary should reflect that mix instead of drifting into broad statements about being hardworking or detail-oriented.
Your first sentence should establish your title, years of experience, and primary analytical environment. A line such as the sample's "Excel Data Analyst with over 5 years of experience in extracting insights from complex datasets using Excel and SQL" works because it immediately tells the reader where you operate.
Use the next sentence or two to connect your core tools to business outcomes. Mention work such as customized reporting, data quality improvement, dashboard support, or process automation. The strongest summaries tie those capabilities to results like faster reporting cycles, better decision support, or reduced errors.
Aim for a short paragraph, usually three to four lines. That gives you enough room to show focus without repeating the experience section. Every phrase should earn its place by clarifying your technical strengths, analytical range, or track record in business-facing reporting.
A sharp summary helps the employer place you quickly: someone who can work through complex datasets, build dependable Excel-driven analysis, and produce reporting that supports real decisions. That is the standard this opening paragraph should meet.
An effective Excel Data Analyst resume makes your analytical process easy to follow. It should show where you used Excel and SQL, how you improved reporting or data quality, and what business value came from your analysis.
Use Wozber's free resume builder to tighten the structure, improve ATS optimization, and tailor each section to the posting with language that reflects your real experience. When the resume is aligned this way, hiring teams can quickly see whether you are ready to step into the reporting, analysis, and data integrity demands of the role.